

Tailor-made SkySpark® solutions
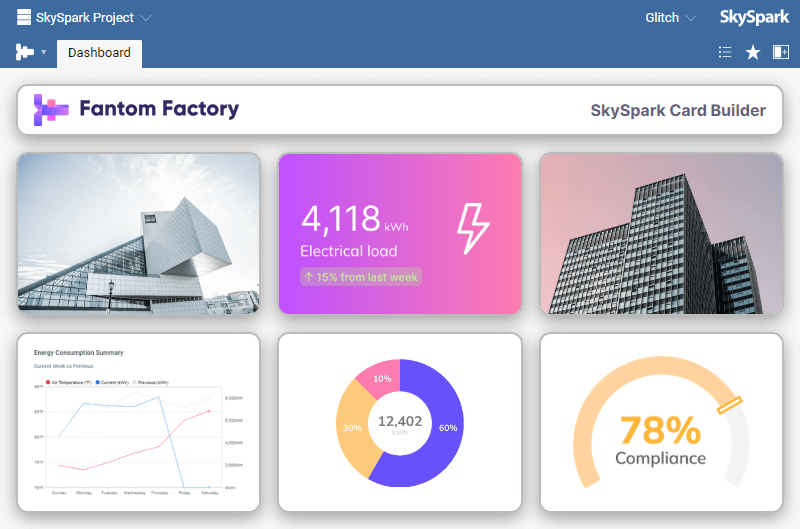
- Visually stunning user-friendly dashboard data at a glance
- Responsive high quality displays for different screen sizes
- Real-time monitoring and customised alerting tools
- Data reports for predictive analytics to aid in decision making
- Energy costs that are easier to target and calculate
- Developable integrations for machine learning and 3rd party
Read about our client work
Important steps for building a dashboard
Only display essential data
A dashboard should be quick and easy to read "at a glance".
Otherwise you may consider designing a more detailed analytical view instead.
Decide which visuals to use
The best and most sophisticated designs are usually minimal and clear.
Your dashboard will only be used if it is easy to read and understand.
Review your data feeds
Ensure you have reliable data to display.
It can be very embarrassing to release a new dashboard only to have it show "missing data" errors!

SkySpark® Card Builder
Looking for a simpler alternative to a custom designed dashboard? Try our SkySpark Card Builder for enhanced card dashboards. They are mobile responsive and reusable with only Axon knowledge required.
Use our online tool to design your preferred visualisations. We'll be in touch to customise your Card Builder extension and to check if you need any extra help with your dashboard data too.
Looking for inspiration?
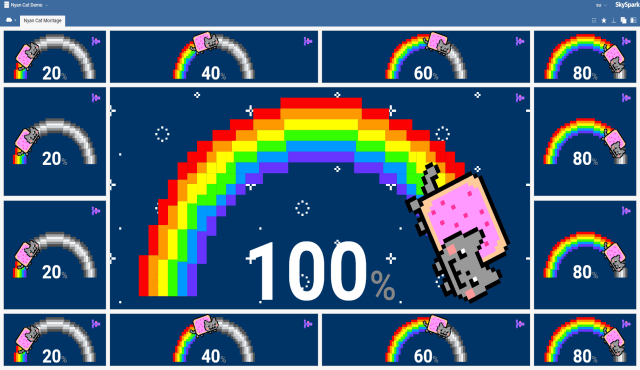
If you can dream it - (Well, mostly!)
We can help you to create new imaginative designs or build to custom order by working with your own graphic designers.


